Tourism has important contribution towards Indonesia’s economy and the role tends to increase through time. In 2018, 15.8m foreign visitors spent US$16b in Indonesia, up from 8.8 visitors spending $10b in 2013. Domestic tourism is also rising, with 303m trips and Rp291t in spending in 2018, from 250m trips and Rp178t in spending. Given these developments, what have been the impacts of tourism on poverty and income distribution? This is the topic of the FKP presentation on Thursday, 14 May 2020 with Riyanto Umar (LPEM FEB UI) presenting research co-authored with Djoni Hartono (Department of Economics, FEB UI), M. Dian Revindo (LPEM FEB UI) dan Natanael W.G. Massie (LPEM FEB UI)
In their study, the researchers looked at the expenditure flows from tourism activities in order to trace the impact of tourism on the distribution of income and poverty. Below is a snapshot of what those expenditures were for foreign and domestics tourists. For foreign tourists, hotel and accommodation make up the largest expenditure (42%) followed by restaurant visits (20%) and domestic transport (13%). Domestic tourists spent most on transport (37%) and restaurant visits (22%), followed by hotel and accommodation (10%).
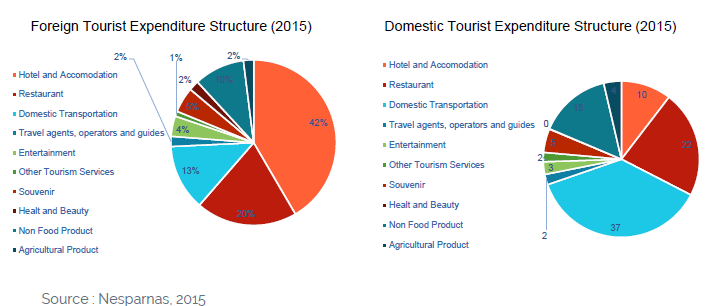
What do tourists spend on?
To analyse the impacts of these spending, first the researchers employed a panel data regression model to test the impact of tourism on poverty reduction and income distribution using provincial level data from 2013 to 2015. Do regions with economic base in tourism activities tend to have a lower poverty rate and more equitable distribution of income? The results suggest that yes, they have 1.5% to 3.4% lower poverty rates. Further, tourism-based regions tend to have a smaller poverty depth index and, albeit a very small difference, a lower rate of inequality.
Secondly, the researchers used the Miyazawa input-output model to study the distribution of spending in the national economy. The Miyazawa model divides the economy into 33 sectors and multiple job types (formal and informal) which allows for analysis of which sectors and which type of workers receive the benefits from tourism spending. Based on this model, in 2016 the spending from tourism activities contributed to 5.81% of national GDP and 4.30% of national total employment. The impact was found to be greater for urban households (particularly the urban poor) than for rural households in terms of increased household income from higher wages.
Finally, the researchers employed a microeconomic simulation to analyse the impact of tourism spending on poverty and income inequality. To do this they used information on the value of household income multipliers for each income class based on the Survei Sosial Ekonomi Nasional (SUSENAS) household data from BPS. The SUSENAS household data was divided into 20 groups based on expenditure deciles and further differentiated between urban and rural households to analyse the economic scenarios of ‘with tourism’ and ‘without tourism’. Their findings indicate that the total poor population, the poverty depth index and the poverty severity index are all lower in the ‘with tourism’ scenario than in the ‘without tourism’ scenario in 2014, 2015 and 2016. Researchers also found that domestic tourist activities have as much importance in providing economic impacts especially in terms of reducing poverty and income inequality.
A detailed description of the research methods and findings are provided in the accompanying video and slides which can be downloaded from the side bar.

![[FKP hosted by LPEM FEB UI] Pengelolaan sampah di Indonesia: tantangan dan peluang](https://www.fkpindonesia.org/wp-content/uploads/2026/06/Collage-4-500x383.jpg)
![[FKP hosted by LPEM] When credit expands, who gets funded? Monetary injection and “zombie firm” risk](https://www.fkpindonesia.org/wp-content/uploads/2026/05/3-1-500x383.jpg)